How to Use the Graph View

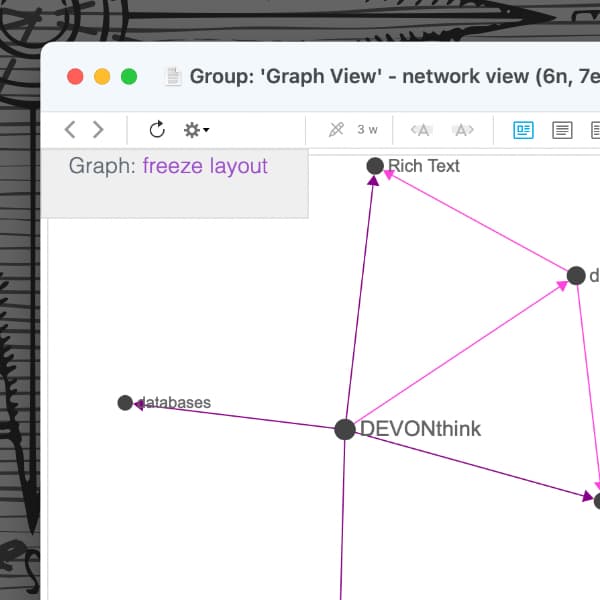
Sometimes a visualization is helpful to see the connections between things, e.g., between different documents. One of our intrepid community members, @benoit.pointet, created a script for DEVONthink that allows you to generate a network graph showing interconnecting links between documents. Some people using the Zettelkasten method of note-taking find this very handy. Here is a brief overview.
You can install the script by clicking on the small paper roll icon in the menu and then selecting More Scripts. This will open the Support Assistant and there you can install the script Graph View. Alternatively, select View > Sidebar > Extras from the menu and install the script from there.
In order to generate a graph, select documents and run the script from the Scripts menu. Answer a few setup questions or accept the defaults regarding the appearance of the resulting graph. A new DEVONthink window will open, displaying a visualization of the links between any of the selected documents. This includes WikiLinks and item links.
You can read more about this script from the author at Graph view : a network visualization script for DT. He also has information on his GitHub repository for the graph view.
We hope this script proves useful for you and a warm thank you to Benoit for providing the script to everyone.
Note: This article deals with an older app generation. Interface elements, menu paths, and procedures could differ.
